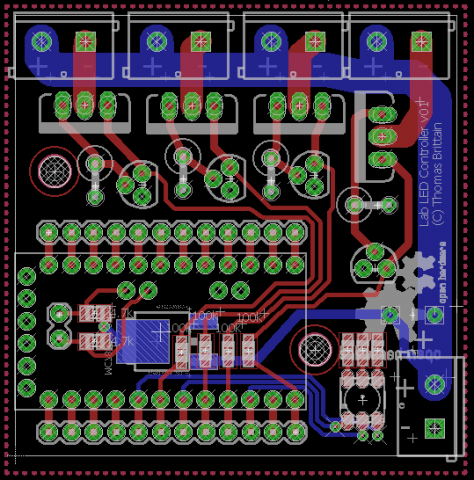
Individuals Experiencing Homelessness

This graph shows the trend of those homeless in Tarrant County, week-to-week who meet the following conditions:

  1. The person counted has stayed at least one night in a Night-by-Night shelter of the week counted.
  2. Or the person counted has been contacted by Street Outreach of the week counted.
  3. Or the person was active in an Entry / Exit shelter program within the week of the count.

Most likely the count is inflated approximately 33%, given there is a large known number of duplicates in the count. The software used to generate the data has no administrator option to merge duplicates. A request has been made for mass merger.

Active in Rapid Rehousing

Another trend found in the graph is a week-to-week count of those homeless who are active in a Rapid Rehousing (RRH) project.

The duplicate issue should not be as pronounced here, as even if a duplicate where created during the sheltered phase of a participant’s stay in homelessness, then only one of the pair would be enrolled into the housing project. Therefore, enrollment into housing is a natural filter.

Active in Permanent Supportive Housing

This trend is similar to the RRH trend.

Notice the line is flat. This is to be expected, as entry and exits are rare in Permanent Supportive Housing projects.

Subpopulations

This graph relates to the Trends of Homelessness, Rapid Rehousing, and Permanent Supportive Housing graph. It looks at the last week of the same data. Of those participants who are still actively homeless (and therefore eligible for housing), what sorts of barriers do these individuals face. HUD refers to these groups of individuals with particular difficulties as “subpopulations.”

It is important to understand these barriers are not mutually exclusive. For example, Jane could report both a Mental Health Problem and Substance Abuse Disorder and she would therefore be counted in both sub-populations.

The three are categories defined as follows:

  • Eligible for Rapid Rehousing are individuals who are actively in a homeless situation and are not met the chronically homeless threshold.
  • Eligible for Permanent Supportive Housing are individuals who are actively in a homeless situation are have met the threshold of chronically homeless
  • All Eligible for Housing is the sum of both Eligible for Rapid Rehousing and Eligible for Permanent Supportive Housing
  • It should be noted, Eligible for Rapid Rehousing and Eligible for Permanent Supportive Housing are mutually exclusive. Therefore, the All Eligible for Housing is an accurate count save the duplicates described above.

Trend of Subpopulations

Churning Data into Information

I work with a lot of data on the behalf of an agency without a lot of money. Exploring free-to-use and open-source tools is key to being effective in my job.

Recently, I’ve written a a couple of series on how to use R and SQL to sort through Homeless Management Information System data.

These data are essential to local governments helping individuals experiencing homelessness to be housed quickly and appropriately.

But one area R and SQL have not delivered is on-line interactive dashboards. Data is one thing, but easy to digest information is really key to informing stakeholders how the system is working to end homelessness.

In other projects I’ve attempted to generate graphs as images and upload to a static link. Then, each time the data change re-generate replace the image. But, most website servers cache the images so it is not ideal.

This has pushed me to try to learn D3.

I’m not going to lie, I’ve felt confused by languages, IDEs, and libraries. And I’ve overcome most of the these challenges. But I’ve never been so confused as by the layout and syntax of D3. The dyslexic feeling I get trying to work in D3 has discouraged me from spending too much time on it.

But recently I decided to take another stab at it– this time I lucked out and found the C3.js.

Essentially, C3 is a library which greatly simplifies D3. It boils down building a graph into a set of options passed to the C3 graph builder as a JSON object.

This code:

var chart = c3.generate({
    data: {
        x: 'Date',
        y: '# Individuals',
        xFormat: '%Y-%m-%d',
        url: 'https://ladvien.com/projects/d3/data/trendsInTX601.csv',
        type: 'line',
        // colors: {
        //     Count: '#990000'
        // }
        names: {
            NumberHomeless: "Homeless",
            NumberInRRH: "Rapid Rehousing",
            NumberInPSH: "Permanent Supportive Housing"
        }
    },
    
    title: {
        text: "Homeless or Formerly Homeless in TX-601"
    },

    legend: {
        show: true
    },

    axis: {
        x: {
            type: 'timeseries',
            tick: {
                count: 4,
                format: '%Y-%m-%d',
                // rotate: 90,
                multiline: false,
                
                culling: {
                    max:5 
                }
            }
        },
        y: {
            max: 3000,
            min: 0,
            label: "# Individuals"
            // Range includes padding, set 0 if no padding needed
            // padding: {top:0, bottom:0}
        },
    },
    
    point: {
        r: 0
    }
});

Using this CSV:

Produces the following graph:

One Hiccup

I did run into a one hiccup in setup. It seems the most recent version of d3 (version 4.0) has had much of its API overhauled. In such, it will not work with C3. But D3 v3 is still available from the D3 CDN:

<script src="https://d3js.org/d3.v3.min.js"></script>

Calling this library and following the instructions outlined by the C3 site, you can be generating graphs in little time.

Updating Data Securely and On Schedule

Now that I’ve the ability to use R and SQL to sort through my data, and I could quickly generate graphs using D3 and C3, it’d be really nice if a lot of this could be automated. And luckily, I’d run into a few other tools which made it pretty easy to replace the data on my C3 graphs.

Rsync

Rsync is primarily a Linux tool, but it is available on Windows as well. It is nice since it will allow you to quickly reconcile two file-trees (think of a manual Dropbox).

It will also allow you to sync a local file tree with a server file tree across an SSH connection. For example, I use the following command to sync the data mentioned above to the server

rsync -avz /Users/user/data/js-practice/d3/* ladvien@ladvien.com:/usr/share/nginx/html/projects/d3/

After running this command it will prompt for a password to access the server. Then, it will proceed to sync the two file-trees. Nifty!

This allows me to quickly update the data on the graph. Now, if only there were a way to automatically insert my password, then I could write a script to automate the whole process.

Python Keyring

Python Keyring is a tool which allows you to save and retrieve passwords from your PC’s keyring.

It is compatible with:

  • Mac OS X Keychain
  • Freedesktop Secret Service (requires secretstorage)
  • KWallet (requires dbus)
  • Windows Credential Vault

If you have Python installed you can install the Keyring tool with Pip:

$pip install keyring

After, you can store a password in the keyring by using the command-line tool. You will need to replace username with the name of your server login.

$keyring set system username

And retrieve it with:

$keyring get system username

This is great. It means we can store our password in the keyring and retrieve it securely from a script.

Great! Now we could write a script to have Rsync sync the any data changes locally with the server. Right? Well, almost. We needed one more tool.

SSHPass

There is a problem with using Rsync to sync files remotely from a script. When Rsync is called from a script it will not wait for parameters to be passed to the tool. Sigh.

Luckily, I’m not the only with this problem and a tool was created to solve this problem.

If you are on a Mac you’ll need to use Brew to install SSHPass.

brew install https://raw.githubusercontent.com/kadwanev/bigboybrew/master/Library/Formula/sshpass.rb 

There we go! Now we can automate the whole process.

I wrote this script to do the dirty work:

#!/bin/sh
PASSWORD=("$(keyring get system ladvien.com)")
ECHO ""
ECHO "****************************"
ECHO "* Updating D3 Projects     *"
ECHO "****************************"
ECHO ""
sshpass -p "$PASSWORD" rsync -avz /Users/user/data/js-practice/d3/* root@ladvien.com:/usr/share/nginx/html/projects/d3/

Cron

Ok! One last bit of sugar on this whole process. Let’s create a Cron job. This will run the script in the background at an interval of our choosing.

For me, I’ve a staff who pulls data and runs a master script every Monday. So, I’ll set my automated script to update my C3 graph data on Tuesday, when I know new data is available.

You can use Nano to edit your Cron job list.

env EDITOR=nano crontab -e

To run a Cron job on Tuesday we would set the fifth asterisk to 2.

* * * * 2 /the/path/to/our/update_script.sh

And don’t forget to make the update_script.sh executable.

chmod +x update_script.sh

I’m a hacker hacking with a hacksaw!

Setup Headless WiFi on Re4son's Kali Pi

I bought a few Raspberry Pi Zero W’s for $10. It was happenstance I also purchased the Udemy course Learn Ethical Hacking from Scratch. I figure, I might as well put these things together.

I also discovered the Sticky Fingers Kali Pi kernel and distros put together by Re4son.

It has worked well so far. However, I’ve not fully tested the Bluetooth LE hardware on the custom kernel.

One of the issues I’ve had is not being able to connect to new hotspots headlessly. Usually, you’d boot the rp0w connected to a monitor, keyboard, mouse, and edit wpa_supplicant.conf directly. But what if you want to go into a new location with only your laptop and the rp0w. How would you add the wifi credentials to the rp0w without a monitor, etc.

For awhile, I tried to get the ethernet gadget setup to work on the rp0w without any luck. I think the problems relates to trying to use the gadget hardware on a Mac rather than a Windows machine.

In the end, I decided I would add a script which would do the following:

  1. Mount the /boot partition (which is editable through PC’s SD card reader).
  2. Look for a file on the /boot called “wpa_supplicant.txt” and copy it to the /etc/wpa_supplicant.conf
  3. Look for a file on the /boot called “interfaces.txt” and copy it to the /etc/networks/interfaces
  4. Unmount /boot
  5. Remove the /boot directory

I saved this script in /root as wifi_setup.sh. I then added a call to it in /etc/rc.local

#!/bin/sh -e
#
# rc.local
#
# This script is executed at the end of each multiuser runlevel.
# Make sure that the script will "exit 0" on success or any other
# value on error.
#
# In order to enable or disable this script just change the execution
# bits.
#
# By default this script does nothing.
/root/wifi_setup.sh || exit 1
exit 0

Here’s the wifi_setup.sh

#!/bin/bash

if [ ! -d "/boot" ]; then
        echo 'Mounting /boot'
        cd ..
        mkdir /boot
        mount /dev/mmcblk0p1 /boot
fi

if [ -f "/boot/wpa_supplicant.txt" ]; then
        echo 'Applying wpa_supplicant'
        cp /boot/wpa_supplicant.txt /etc/wpa_supplicant.conf
        mv /boot/wpa_supplicant.txt /boot/wpa_supplicant.applied.txt
fi

if [ -f "/boot/interfaces.txt" ]; then
        echo 'Applying intefaces'
        cp /boot/interfaces.txt /etc/network/interfaces
        mv /boot/interfaces.txt /boot/interfaces.applied
fi

umount /boot
rm -r /boot

This has let me add a new network from my laptop with merely an SD card reader.

HMIS, R, SQL -- Work Challenge Three

Creating a Data Error Report by User

In this work challenge we will combine Client and Enrollment data, then we will add a non-HMIS dataframe which contains user account information. After these data are merged, we will then parse them for missing data elements and provide a by-user list of data errors.

Data Needed

As stated above, the data needed are:

  1. Client.csv
  2. Enrollment.csv
  3. A dataframe containg HMIS user contact info.

The key to this challenge literally is at the end of every HMIS CSV. Each exported CSV contains some metadata which describes how the data were produced.

The DateCreated should represent when the respective row was actually entered into the HMIS. DateUpdated is the last time that row was modified and saved in the HMIS. The UserID is the case-manager who last modified these data. Lastly, the ExportID is the number which identifies a collection of HMIS CSVs to be in the same batch.

We are going to focus in on the UserID element. Notice, you will not find the usernames, real names, email address, or really any contact information for individual HMIS users. However, having a unique user ID in each CSV would still allow HUD to use internal validity tests to determine the reliability of the user.

For us, we are going to take another source of data containing all of the UserIDs and contact information for the users. Now, this will probably be different each HMIS software vendor. But each vendor should have a way to export a list of the users in the system with their UserID, which will allow us to join these data to the HMIS CSVs.

For those participating in the work challenge from my CoC, I’ll provide a CSV with these user data.

After actual user names are joined to the CSVs, then we will begin to parse the CSVs for data errors. If you aren’t yet familiar with the term parse in computer science, think of it as diagraming a setence where we make the computer do all the work. Instead of a sentence, we will be diagraming a row of data to determine if there are any errors.

What’s an HMIS Data Error?

The HMIS Data Dictionary is specific about what a data error is.

  • 8 – Client doesn’t know
  • 9 – Client refused
  • 99 – Data not collected
  • Blank
  • Incomplete response
  • Non-determinable response

Here’s an example of a Client.csv which contains one of each type of error.

PersonalID FirstName LastName DOB SSN DisablingCondition VeteranStatus
ZP1U3EPU2FKAWI6K5US5LDV50KRI1LN7   Tesa 2010-01-01 123-45-6789 1 8
IA26X38HOTOIBHYIRV8CKR5RDS8KNGHV Fela Falla 1999-1-1 4321 1 1
LASDU89NRABVJWW779W4JGGAN90IQ5B2 Sarah Kerrigan   Blahblah 99 0

Here are the data errors:

  1. Tesa is first name blank
  2. Sarah’s DOB is blank
  3. Fela’s SSN is an incomplete response (must be 9 digits)
  4. Sarah’s SSN is non-determinable
  5. Sarah’s DisablingCondition was not collected.
  6. Tesa refused to provide a VeteranStatus.

The Goal

We are going to take a HMIS data and join it with a dataframe containing end-user information. Then, we will create a query to subset the dataframe so we get a dataframe which contains only rows with data errors. Lastly, we will get counts of the types of data errors and the names end-users who’ve caused the most data errors.

The data elements we will look into for errors:

  1. FirstName
  2. LastName
  3. DOB
  4. VeteranStatus
  5. DisablingCondition
  6. RelationshipToHoH

To get this information we will need to do the following:

  1. Load Client.csv, Enrollment.csv, and Users.xlsx
  2. Left join the clientDf and enrollmentDf.
  3. Left join the usersDf to the result of step 2.
  4. Parse the data elements listed above for data errors
  5. Create a dataframe which contains only rows with data errors
  6. Use the SQL Count function to count the number of data errors by the element list above.
  7. Use the SQL Count function to count how many times a end-users name is associated with a row containing errors.
  8. Create a dataframe of these counts
  9. Save the dataframe containing the error counts into an Excel file (.xlsx)

The Resources

Below are the resources which should help for each step:

TBD