I'm fat. Fatter than I want to be. I've not always been fat, I got down to 180 at back in 2008. It took counting calories and weight religiously. The key piece for me was having a graph which I looked at daily showing my outcomes. Over the course of a year I lost 40 pounds. Well, it's time to do it again. I've gained that 40 back over 10 years--and now it needs to go.
Back in 2008 I was using Google to give me the calories of every item I ate and recording them in an Excel document. This food journal was great, but a little more work than it probably should have been.
Back then, I wasn't aware of being a hacker. Now, I plan to throw all my hacker skills at this weight loss plan (hell, I might even go to the gym!)
I signed up for MyFitnessPal. Counting calories worked once, I figure if it aint broke. But then I got to looking at how much work it would take to look at my improvement. I mean, I'd have to actually open the app on my phone and click on the weight loss section. Shesh--who designed that app? Two actions to get where I needed--ain't no one got time for that.
Enter hacker skills. I discovered there is a Python library which allows scraping of data.
This wonderful little library is written and provided by CoddingtonBear.
I figure, I'd write a Python script to scrap the data, save it to a CSV, create an SQL-R script to join the nutrition and weight information, use ggplot to plot the data, save the plot as a PNG, and then copy this plot to a dedicated spot on Ladvien.com. Lastly, I'd write a bash script to run every night and update the graph. Simples!
And c'mon, opening a webpage is a lot easier than tapping twice.
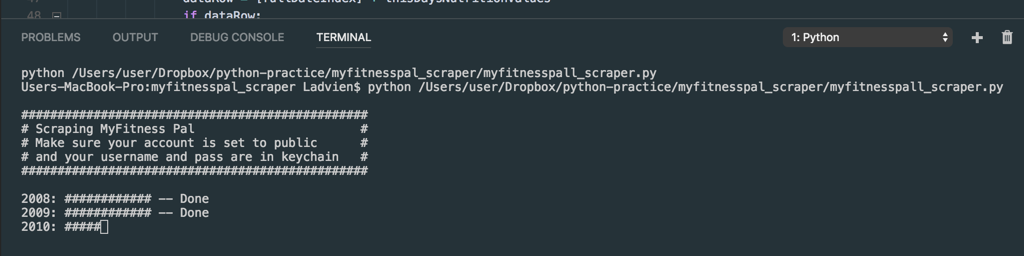
Well, after a few hours of coding, I've got the first step of the project complete.
import myfitnesspal
import csv, sys, os
from datetime import datetime

# Get account info
client = myfitnesspal.Client('cthomasbrittain')
# Set start year
startYear = "2008"
# Get limits
beginningDate = datetime.strptime(startYear, "%Y").date()
beginningYear = beginningDate.year
daysInMonth = {1:31, 2:28, 3:31, 4:30, 5:31, 6:30, 7:31, 8:31, 9:30, 10:31, 11:30, 12:31}
emptyNutrition = [None, None, None, None, None, None]

print("")
print("################################################")
print("# Scraping MyFitnessPal                        #")
print("# Make sure your account is set to public      #")
print("# and your username and pass are in keychain   #")
print("################################################")
print("")

today = datetime.now().date()
currentYear = today.year

print("")
print("################################################")
print("# Get nutrition and weight information         #")
print("################################################")
print("")

# Loop over years from beginingYear.  Make sure last year is inclusive.
for yearIndex in range(beginningYear, currentYear+1):

    # Create a file name based on this year's data
    thisFileName = "healthData_%s.csv" % yearIndex

    # Open CSV as read and write.
    # If file exists, open for read / write
    #   else, create file, write only.
    try:
        f = open(thisFileName, "r+")        # Check to see if file is complete,
        row_count = sum(1 for row in f)     # else, overwrite the file
        if(row_count != 366):               # A year of rows plus headers, and an empty line at end.
            f = open(thisFileName, "w+")
            row_count = 0
    except EnvironmentError:
        f = open(thisFileName, "w+")        # If file does not exist, create it.
        row_count = 0

    writer = csv.writer(f)

    # Check number of lines. If the year wasn't captured, start over.
    if(row_count < 365):
        # Write headers for totals
        writer.writerow(["Date", "Sodium", "Carbohydrates", "Calories", "Fat", "Sugar", "Protein", "Weight"])
        sys.stdout.write(str(yearIndex)+": ")   # Print has a linefeed.
        sys.stdout.flush()
        for monthIndex in range(1, 12+1):

            beginningOfMonthStr = "%s-%s-%s" % (yearIndex, monthIndex, 1)
            endOfMonthStr = "%s-%s-%s" % (yearIndex, monthIndex, daysInMonth[monthIndex])

            beginningOfMonth = datetime.strptime(beginningOfMonthStr, "%Y-%m-%d").date()
            endOfMonth = datetime.strptime(endOfMonthStr, "%Y-%m-%d").date()

            thisMonthsWeights = dict(client.get_measurements('Weight', beginningOfMonth, endOfMonth))

            for dayIndex in range(1, daysInMonth[monthIndex]+1):

                fullDateIndex = "%s-%s-%s" % (yearIndex, monthIndex, dayIndex)
                thisDate = datetime.strptime(fullDateIndex, "%Y-%m-%d").date()
                if(thisDate > today):
                    break;

                thisDaysNutritionData = client.get_date(yearIndex, monthIndex, dayIndex)
                thisDaysNutritionDataDict = thisDaysNutritionData.totals
                thisDaysNutritionValues = thisDaysNutritionDataDict.values()

                thisDaysWeight = [(thisMonthsWeights.get(thisDate))]

                if(len(thisDaysNutritionValues) < 6):
                    thisDaysNutritionValues = emptyNutrition

                dataRow = [fullDateIndex] + thisDaysNutritionValues  + thisDaysWeight
                if dataRow:
                    writer.writerow(dataRow)

            sys.stdout.write("#")
            sys.stdout.flush()
        print(" -- Done.")
        f.close()
    else:
        print((str(yearIndex)+": Exists and is complete."))
And then we add some R to join the data together and automate plotting, and saving the plots as images.
library(ggplot2)
library(scales)

cat("*******************************************************\n")
cat("* Starting R                                          *\n")
cat("*******************************************************\n")
cat("\n")
cat("*******************************************************\n")
cat("* Combining Health Data                               *\n")
cat("*******************************************************\n")
cat("\n")
# Thanks Rich Scriven
# https://stackoverflow.com/questions/25509879/how-can-i-make-a-list-of-all-dataframes-that-are-in-my-global-environment
healthDataRaw <- do.call(rbind, lapply(list.files(pattern = ".csv"), read.csv))
# Fill in missing values for calories
healthDataRaw$Calories[is.na(healthDataRaw$Calories)] <- mean(healthDataRaw$Calories, na.rm = TRUE)

date30DaysAgo <- Sys.Date() - 30
date90DaysAgo <- Sys.Date() - 90
date180DaysAgo <- Sys.Date() - 180

cat("*******************************************************\n")
cat("* Creating Weight Graph                               *\n")
cat("*******************************************************\n")
healthData <- healthDataRaw[!(is.na(healthDataRaw$Weight)),]
healthData$Date <- as.Date(healthData$Date)
healthData <- with(healthData, healthData[(Date >= date30DaysAgo), ])
p <- ggplot(healthData, aes(x = Date, y = Weight))+
  geom_line(color="firebrick", size = 1) +
  labs(title ="Ladvien's Weight", x = "Date", y = "Weight")
p
ggsave("ladviens_weight.png", width = 5, height = 5)

cat("\n")

cat("*******************************************************\n")
cat("* Creating Calories Graph                             *\n")
cat("*******************************************************\n")
cat("\n")
#healthData <- healthDataRaw[!(is.na(healthDataRaw$Calories)),]
healthData$Date <- as.Date(healthData$Date)
healthData <- with(healthData, healthData[(Date >= date30DaysAgo), ])
p2 <- ggplot(healthData, aes(x = Date, y = Calories))+
  geom_line(color="firebrick")
p2

png(filename="ladviens_calories.png")
plot(p2)
dev.off()

cat("*******************************************************\n")
cat("* Finished R Script                                   *\n")
cat("*******************************************************\n")
cat("\n")
Lastly, let's write a bash script to run the Python and R code, then copy the images to Ladvien.com
#!/bin/sh
PASSWORD=("$(keyring get system ladvien.com)")

Python myfitnesspall_scraper.py

Rscript myfitnesspal_data_sort.R

ECHO ""
ECHO "*******************************************************"
ECHO "* Syncing files to Ladvien.com                        *"
ECHO "*******************************************************"
ECHO ""

# Used SSHPass
# https://gist.github.com/arunoda/7790979

sshpass -p "$PASSWORD" scp ladviens_weight.png ladviens_calories.png root@ladvien.com:/usr/share/nginx/html/images/
And here's the result:
My weight:

And my calories:

Next, I'll probably tweak ggplot2 to make the graphs a little prettier. Also, I'll setup a Raspberry Pi or something to run the bash script once a night. Why? Lolz.